Project Overview
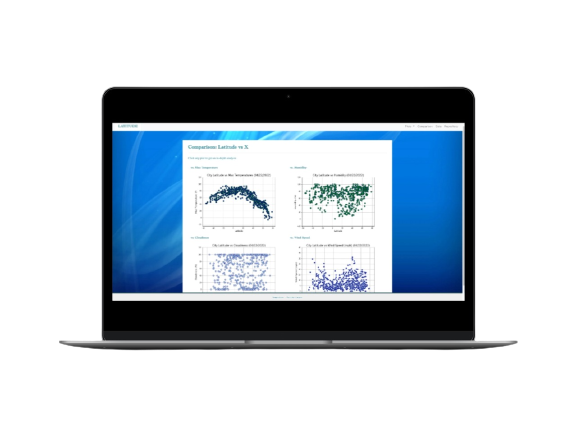
Data is more powerful when we share it others! We used what we've learned about HTML and CSS to create a dashboard featuring the analysis that we've done with a previous data set.
The Web Visualization Dashboard consists of individual pages for each plot and a way to navigate between them. The pages contain the landing page, viusalizations, comparison of all plots, and data table used to build plots.
Tools Used
HTML
CSS
Bootstrap
Python
Pandas
Github
GIT

