Project Overview
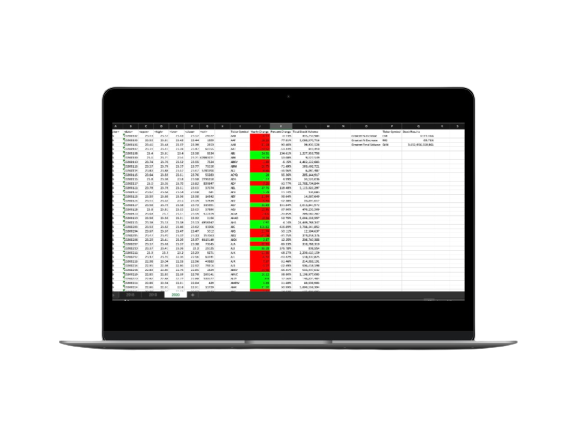
The stock market creates massive data in a fraction of seconds that either increase or decrease one’s investments. Imagine manually analyzing stock data by hand using basic knowledge of excel. It’s likely that you will have some investors, or you, that are indifferent to manually analyzing stock data. Creating a VBA script to arrange the stock data in a fast, proficient process can be the transformation of gaining or losing profit on a ticker. The VBA script can share stock tickers with greatest increase and decrease percentage, stock or greatest total volume, yearly change rate, and percent change. Imagine being able to reveal profitable stocks and/or stock market crashes well in advance. Let’s look at the high-level overview of the VBA script that assisted in summarizing stock data year over year!

